CSAS 2025: Quantifying MLB Home Run Attempts
Table of Contents
1. Overview
For this data challenge, your goal is to use new baseball data on bat speed and swing length to analyze some aspect of the pitcher/batter interaction. We provide pitch-level data from Baseball Savant for 346,250 Major League Baseball plate appearances from 4/2/2024 to 6/30/2024, including relevant Statcast data along with bat speed and swing length on pitches with a swing tracked. Data from the second half of the season will be added after the conclusion of the regular season. Your analysis should involve bat speed and swing length to study any topic related to the batter, pitcher, or batter-pitcher interaction during an at bat.
Since these data are new, there are a variety of topics that have not previously been studied. Below are a few example topics. However, we note that this list is far from exhaustive. Participants should feel free to study any aspect of the batter, pitcher, or batter-pitcher interaction that interests them, provided that bat speed and swing length are used in the analysis in some meaningful way.
1-1. Proposal
Questions:
1. Which conditions indicate a batter most likely to try to hit a home run (Michael & Austin)
- Define which variables determine a home run attempt (swing velocity, angle etc.)
- Find distribution of numerical variables that constitute home run attempt
- Transform events variable to make a separate variable determining home run attempts
- Fit various classification models - What score, innings, batting counts, out counts, and runners are related to successful home runs
- Find a trend related to home run attempts
1-2. Variables
Variable List
| column name | description |
|---|---|
| pitch_type | The type of pitch derived from Statcast. |
| game_date | Date of the Game. |
| release_speed | Pitch velocities from 2008-16 are via Pitch F/X, and adjusted to roughly out-of-hand release point. All velocities from 2017 and beyond are Statcast, which are reported out-of-hand. |
| release_pos_x | Horizontal Release Position of the ball measured in feet from the catcher's perspective. |
| release_pos_z | Vertical Release Position of the ball measured in feet from the catcher's perspective. |
| player_name | Player's name tied to the event of the search. |
| batter | MLB Player Id tied to the play event. |
| pitcher | MLB Player Id tied to the play event. |
| events | Event of the resulting Plate Appearance. |
| description | Description of the resulting pitch. |
| spin_dir | * Deprecated field from the old tracking system. |
| spin_rate_deprecated | * Deprecated field from the old tracking system. Replaced by release_spin |
| break_angle_deprecated | * Deprecated field from the old tracking system. |
| break_length_deprecated | * Deprecated field from the old tracking system. |
| zone | Zone location of the ball when it crosses the plate from the catcher's perspective. |
| des | Plate appearance description from game day. |
| game_type | Type of Game. E = Exhibition, S = Spring Training, R = Regular Season, F = Wild Card, D = Divisional Series, L = League Championship Series, W = World Series |
| stand | Side of the plate batter is standing. |
| p_throws | Hand pitcher throws with. |
| home_team | Abbreviation of home team. |
| away_team | Abbreviation of away team. |
| type | Short hand of pitch result. B = ball, S = strike, X = in play. |
| hit_location | Position of first fielder to touch the ball. |
| bb_type | Batted ball type, ground_ball, line_drive, fly_ball, popup. |
| balls | Pre-pitch number of balls in count. |
| strikes | Pre-pitch number of strikes in count. |
| game_year | Year game took place. |
| pfx_x | Horizontal movement in feet from the catcher's perspective. |
| pfx_z | Vertical movement in feet from the catcher's perpsective. |
| plate_x | Horizontal position of the ball when it crosses home plate from the catcher's perspective. |
| plate_z | Vertical position of the ball when it crosses home plate from the catcher's perspective. |
| on_3b | Pre-pitch MLB Player Id of Runner on 3B. |
| on_2b | Pre-pitch MLB Player Id of Runner on 2B. |
| on_1b | Pre-pitch MLB Player Id of Runner on 1B. |
| outs_when_up | Pre-pitch number of outs. |
| inning | Pre-pitch inning number. |
| inning_topbot | Pre-pitch top or bottom of inning. |
| hc_x | Hit coordinate X of batted ball. |
| hc_y | Hit coordinate Y of batted ball. |
| tfs_deprecated | * Deprecated field from old tracking system. |
| tfs_zulu_deprecated | * Deprecated field from old tracking system. |
| fielder_2 | Pre-pitch MLB Player Id of Catcher. |
| umpire | * Deprecated field from old tracking system. |
| sv_id | Non-unique Id of play event per game. |
| vx0 | The velocity of the pitch, in feet per second, in x-dimension, determined at y=50 feet. |
| vy0 | The velocity of the pitch, in feet per second, in y-dimension, determined at y=50 feet. |
| vz0 | The velocity of the pitch, in feet per second, in z-dimension, determined at y=50 feet. |
| ax | The acceleration of the pitch, in feet per second per second, in x-dimension, determined at y=50 feet. |
| ay | The acceleration of the pitch, in feet per second per second, in y-dimension, determined at y=50 feet. |
| az | The acceleration of the pitch, in feet per second per second, in z-dimension, determined at y=50 feet. |
| sz_top | Top of the batter's strike zone set by the operator when the ball is halfway to the plate. |
| sz_bot | Bottom of the batter's strike zone set by the operator when the ball is halfway to the plate. |
| hit_distance | Projected hit distance of the batted ball. |
| launch_speed | Exit velocity of the batted ball as tracked by Statcast. For the limited subset of batted balls not tracked directly, estimates are included based on the process described here. |
| launch_angle | Launch angle of the batted ball as tracked by Statcast. For the limited subset of batted balls not tracked directly, estimates are included based on the process described here. |
| effective_speed | Derived speed based on the the extension of the pitcher's release. |
| release_spin | Spin rate of pitch tracked by Statcast. |
| release_extension | Release extension of pitch in feet as tracked by Statcast. |
| game_pk | Unique Id for Game. |
| pitcher | MLB Player Id tied to the play event. |
| fielder_2 | MLB Player Id for catcher. |
| fielder_3 | MLB Player Id for 1B. |
| fielder_4 | MLB Player Id for 2B. |
| fielder_5 | MLB Player Id for 3B. |
| fielder_6 | MLB Player Id for SS. |
| fielder_7 | MLB Player Id for LF. |
| fielder_8 | MLB Player Id for CF. |
| fielder_9 | MLB Player Id for RF. |
| release_pos_y | Release position of pitch measured in feet from the catcher's perspective. |
| estimated_ba_using_speedangle | Estimated Batting Avg based on launch angle and exit velocity. |
| estimated_woba_using_speedangle | Estimated wOBA based on launch angle and exit velocity. |
| woba_value | wOBA value based on result of play. |
| woba_denom | wOBA denominator based on result of play. |
| babip_value | BABIP value based on result of play. |
| iso_value | ISO value based on result of play. |
| launch_speed_angle | Launch speed/angle zone based on launch angle and exit velocity. 1: Weak 2: Topped 3: Under 4: Flare/Burner 5: Solid Contact 6: Barrel |
| at_bat_number | Plate appearance number of the game. |
| pitch_number | Total pitch number of the plate appearance. |
| pitch_name | The name of the pitch derived from the Statcast Data. |
| home_score | Pre-pitch home score |
| away_score | Pre-pitch away score |
| bat_score | Pre-pitch bat team score |
| fld_score | Pre-pitch field team score |
| post_home_score | Post-pitch home score |
| post_away_score | Post-pitch away score |
| post_bat_score | Post-pitch bat team score |
| if_fielding_alignment | Infield fielding alignment at the time of the pitch. |
| of_fielding_alignment | Outfield fielding alignment at the time of the pitch. |
| spin_axis | The Spin Axis in the 2D X-Z plane in degrees from 0 to 360, such that 180 represents a pure backspin fastball and 0 degrees represents a pure topspin (12-6) curveball |
| delta_home_win_exp | The change in Win Expectancy before the Plate Appearance and after the Plate Appearance |
| delta_run_exp | The change in Run Expectancy before the Pitch and after the Pitch |
2. Data Cleaning
2-1. Factors influencing a home run
Since home run attempt includes both success and failure, we decided to count two simple factors:
- Bat speed : how fast a batter swings their bat
- Swing length : distance captured from start of a swing to an impact point
2-2. Setting optimal threshold
Since we have set the standards of a home run attempt, we have to decide the threshold for each of them to see from what point should we consider that the batter tried to hit a home run. For this, we took the following steps:
- Create an ROC curve comparing home runs against bat speed and swing length
- Calculate Youden index using sensitivity and specificity at all possible threshold values, where \( J = \max\{\text{sensitivity}(t) + \text{specificity}(t) - 1\} \)
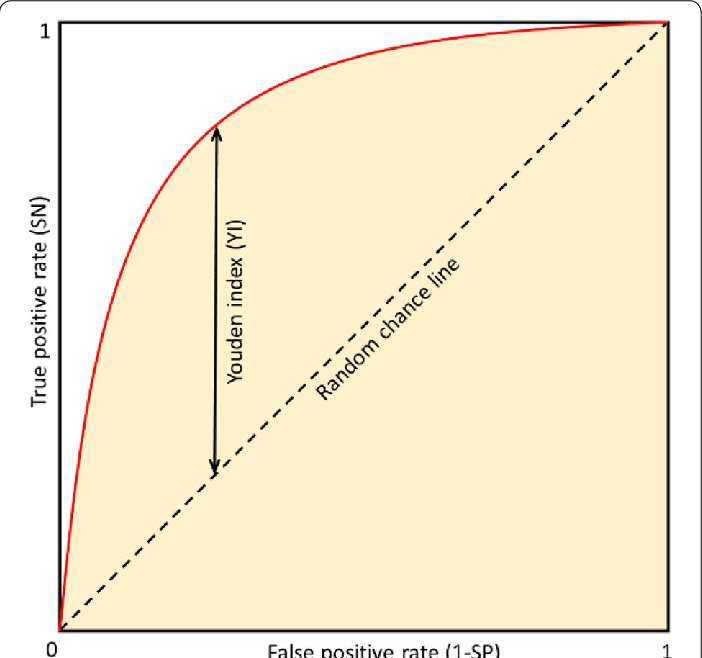
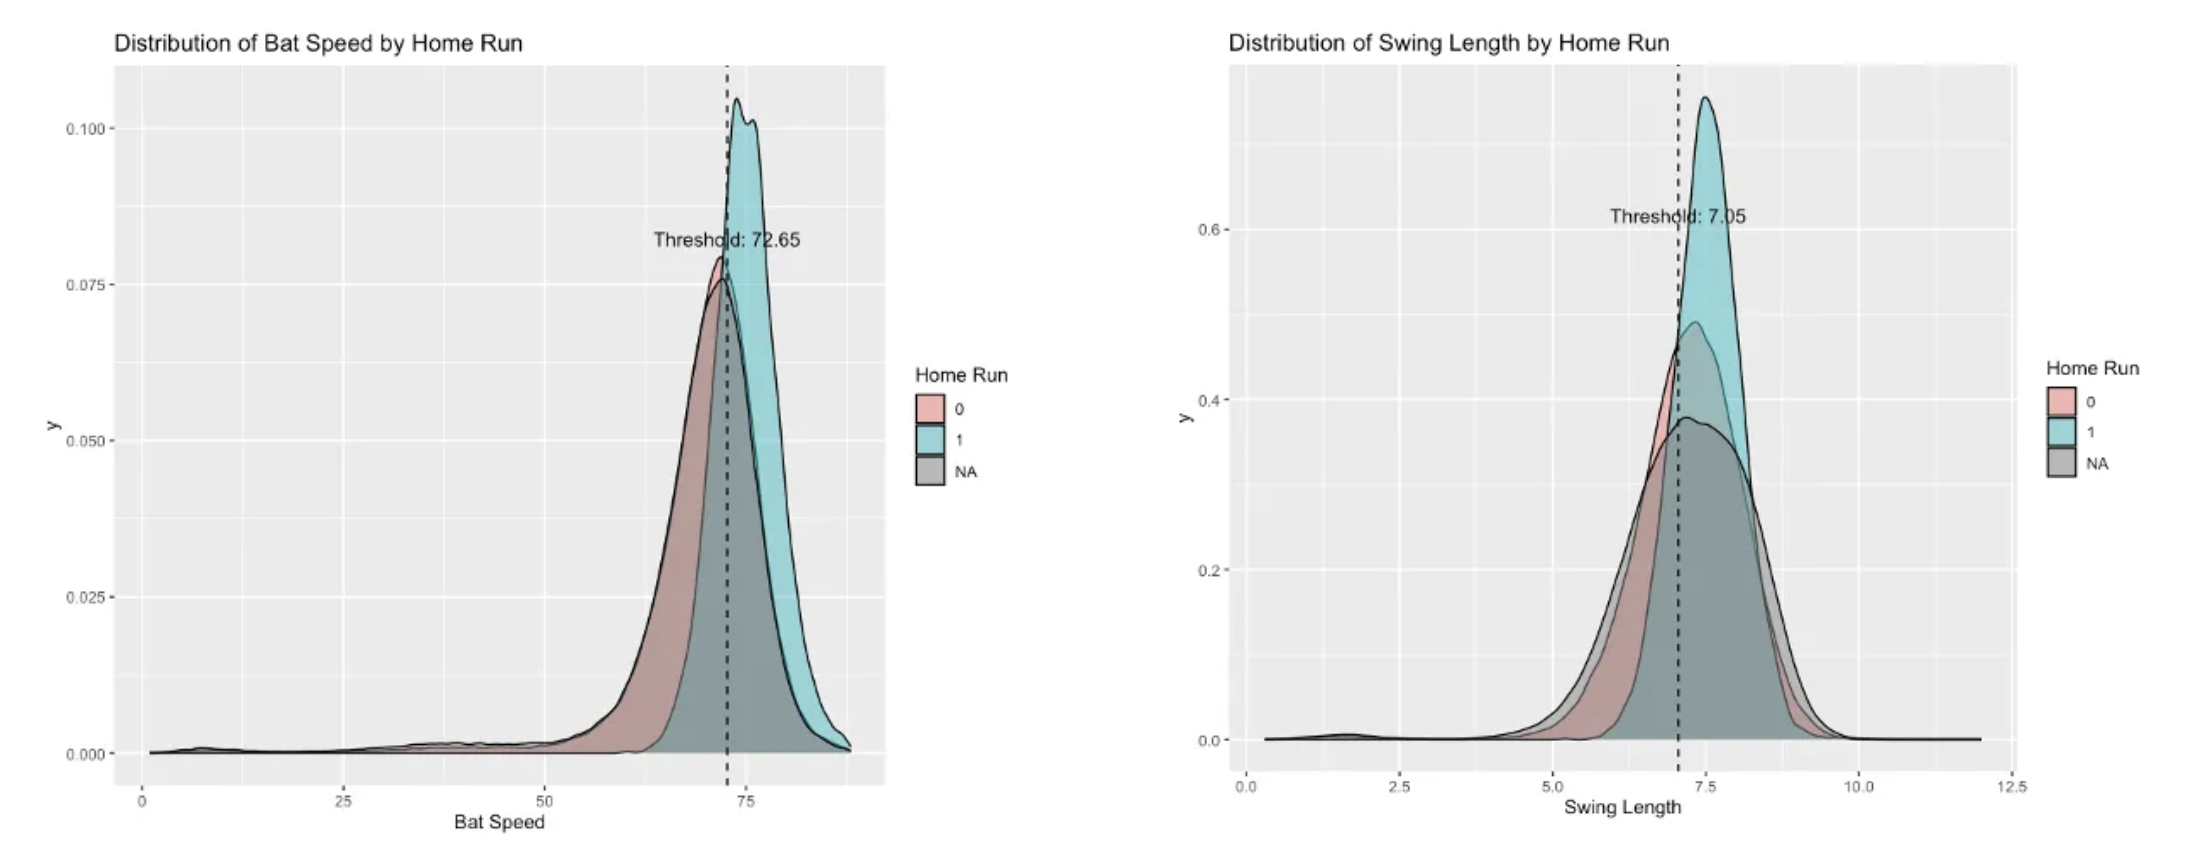
With the above steps, we got the optimal threshold of 72.65 mph for bat speed and 7.05 ft for swing length to create our response variable of home_run_attempt. The graph below shows the distribution of home runs for bat speed and swing length along with their optimal thresholds.
2-3. Variable Selection Method
In terms of variable selection, we first started off by picking 30 potentially significant variables to predict home run attempts, including game situation (inning, outs), pitch characteristics (release position, velocity), and batter/pitcher attributes.
Then, we have tried multiple approaches for variable selection method:
- Forward stepwise selection using BIC
- Backward stepwise selection using BIC
- Recursive Feature Elimination (RFE) with 5-fold CV
The table below is the result:
| Variable Selection Method | Number of features |
|---|---|
| Forward Selection | 9 |
| Backward Selection | 9 |
| RFE | 2 |
Forward and backward stepwise selection method provided the same number of features, but we decided to use backward selection, since it had a lower BIC. Even though RFE would be a very great approach for a variable selection, it gave too few variables this time, so we decided to not use this method.
Below are the list of final selected features:
- balls
- strikes
- at_bat_number
- release_pos_z
- vz0
- az
- effective_speed
- stand
3. Data Modeling
3-1. Model Fitting
After cleaning the data, we have tried fitting various models to predict home_run_attempt:
- Logistic regression : basic linear model
- GAM : taking into account for non-linear relationship as well as interpretability
- Mixed Effects Model : taking into account for individual tendencies of batters and pitchers
- Random Forest : general machine learning model
We decided to choose our best model based on accuracy and the char below was the result:
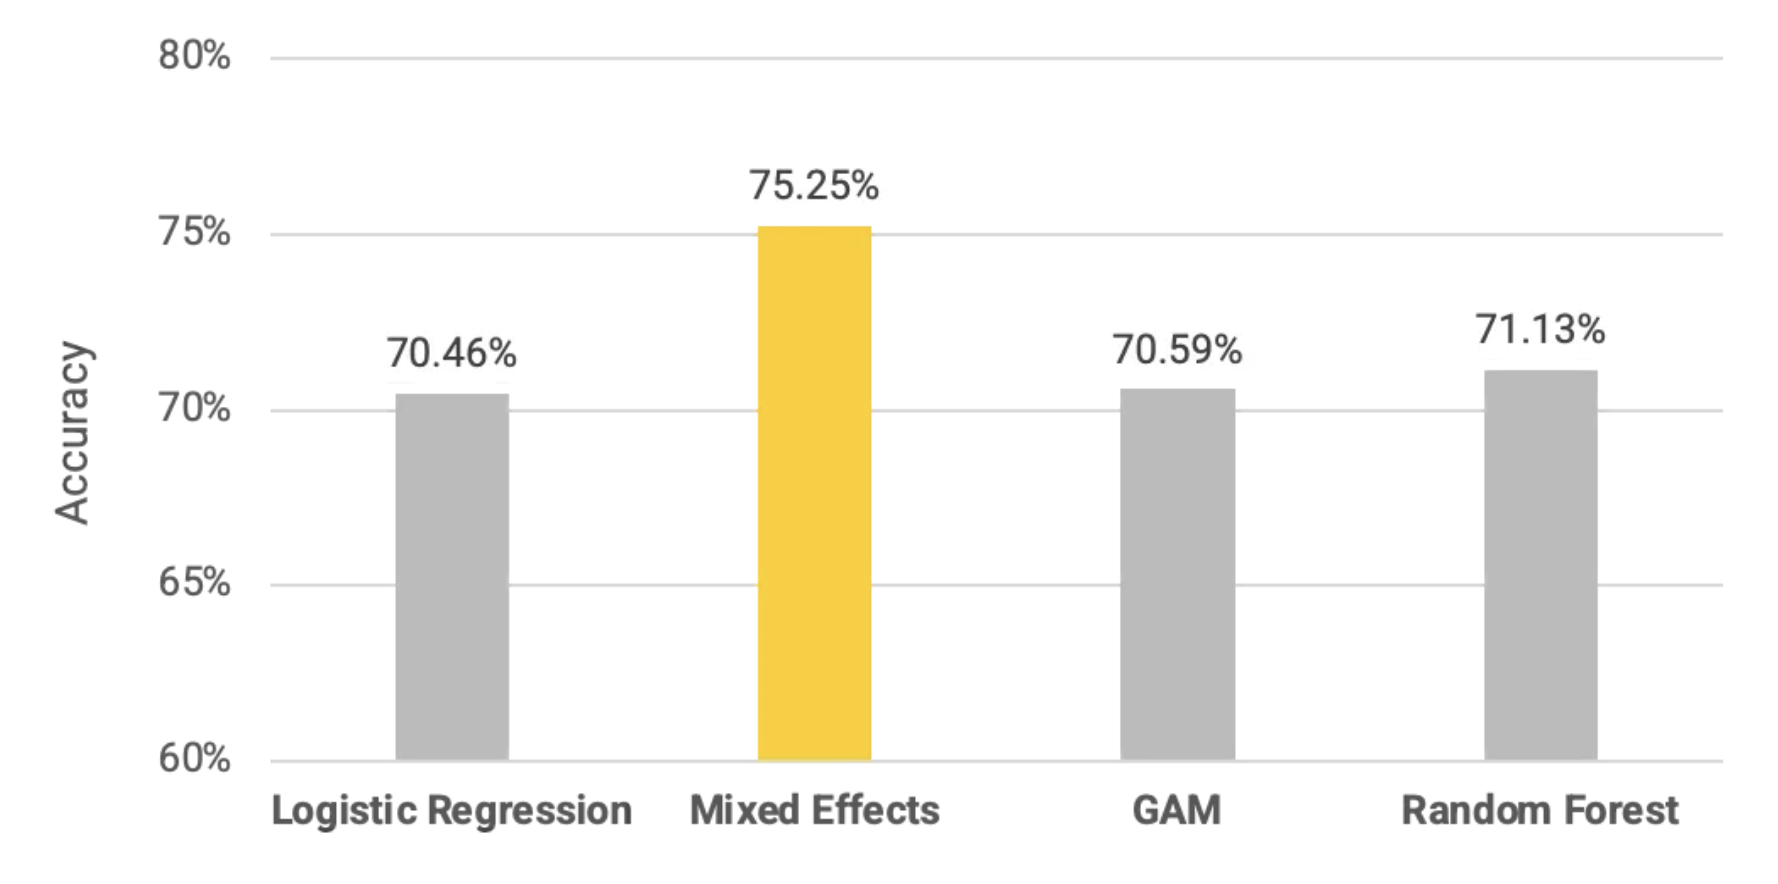
3-2. Result of The Best Performing Model
Since mixed effects model was the best performing model, we decided to take a further look at its result to examine significant factors of home run attempts.
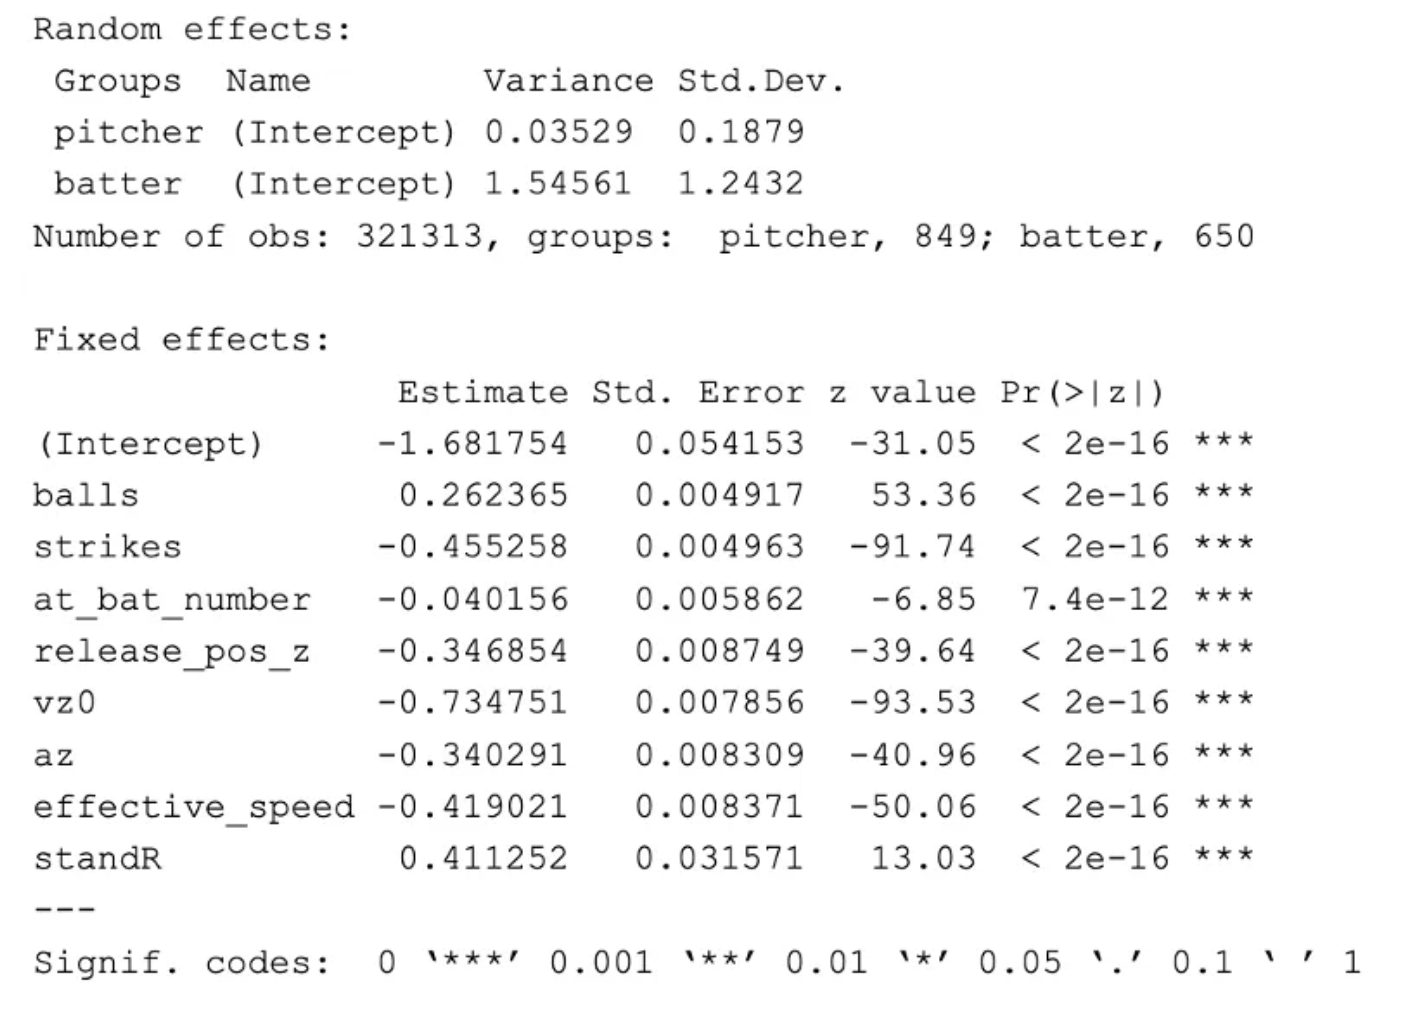
Result summary:
- The variance of
batteris significantly higher thanpitcher, suggesting that batting characteristics have more random variation than pitching characteristics balls: higher ball counts increase the likelihood for batters to attempt home runstrikes: higher strike counts decrease the likelihood for batters to attempt home runat_bat_number: more at bat number slightly decreases the likelihoodrelease_pos_z: higher release position of pitcher decreases the likelihoodvz0: higher pitch velocity in z-dimension decreases the likelihoodaz: higher pitch acceleration in z-dimension decreases the likelihoodeffective_speed: higher pitch speed decreases the likelihoodstandR: right-handed batters are more likely to attempt home run
4. Top 10 Batters with Highest Home Run Success Rate
The chart below has the list of ten batters with the highest home run success rate among those who are above 75% quantile range in the number of making home run attempts. This filter is set to show major batters who are most likely to play the whole game.
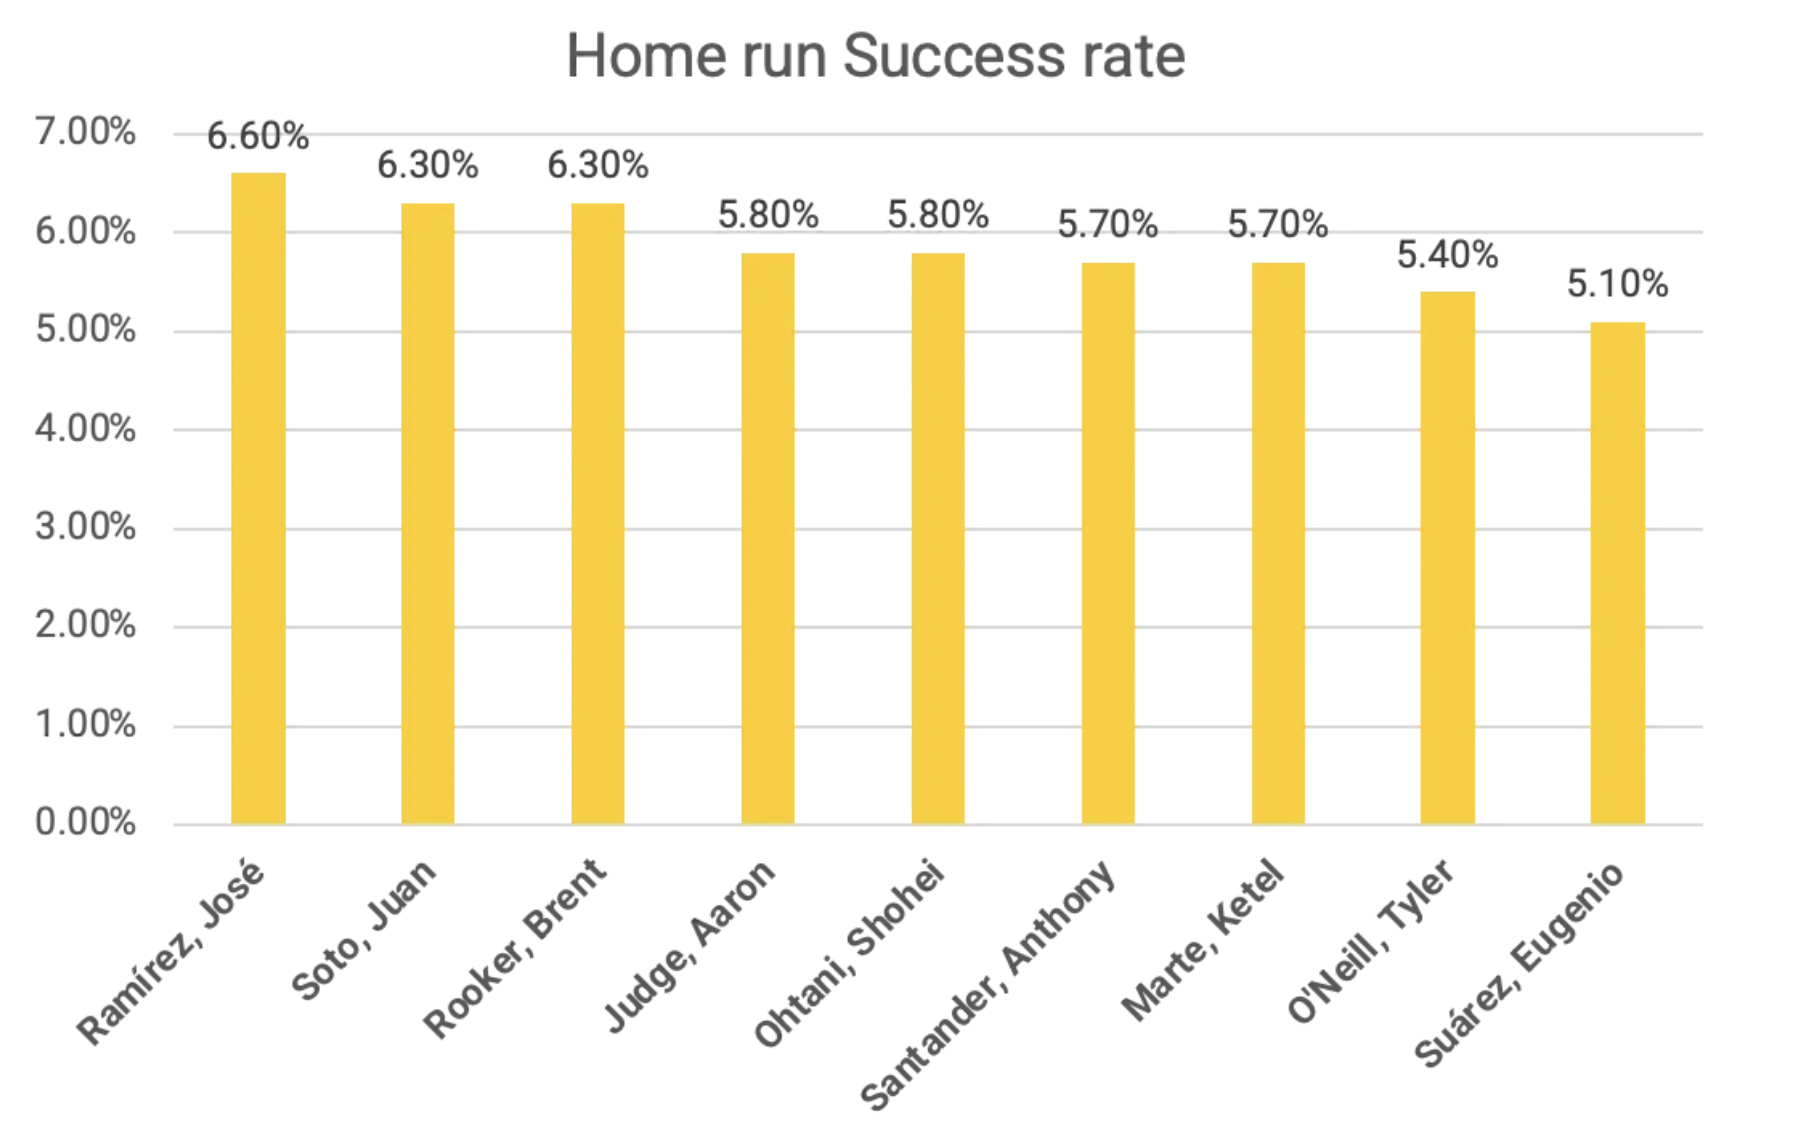
After looking at this chart, another questions came up, which is: "Does higher bat speed and swing length lead to better home run success rate?" To answer the question, we have set the hypothesis as below:
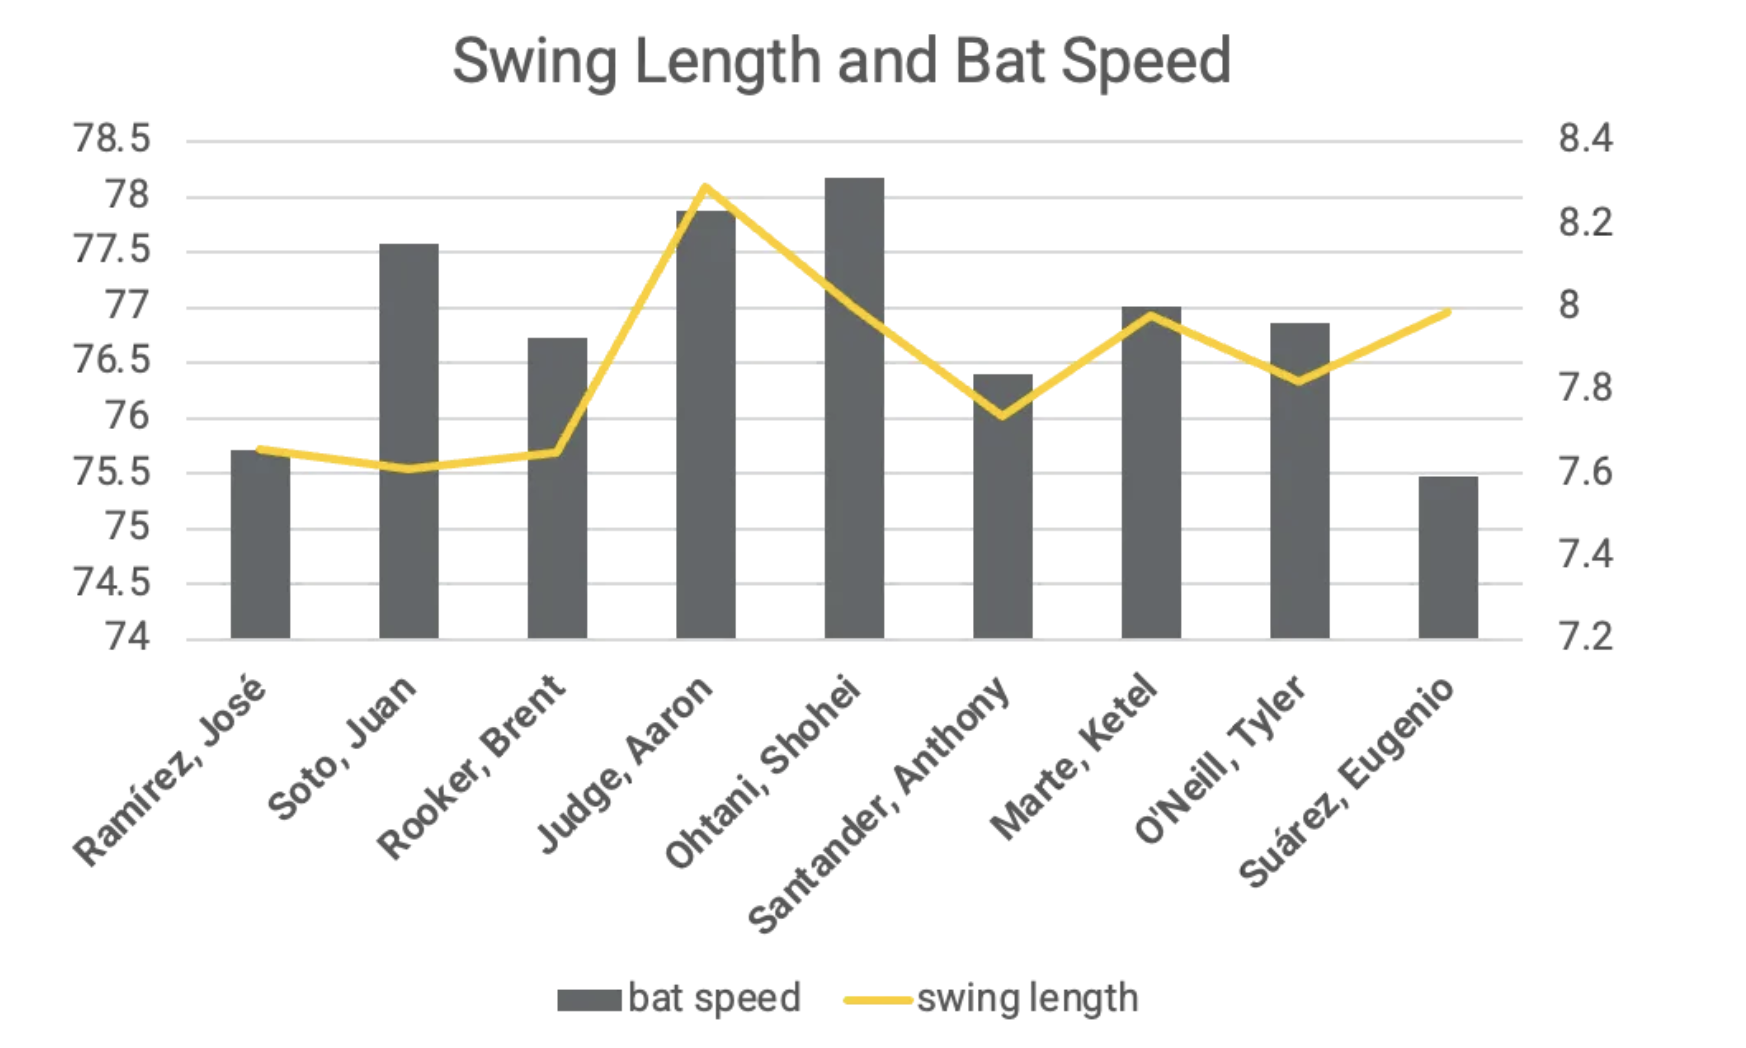
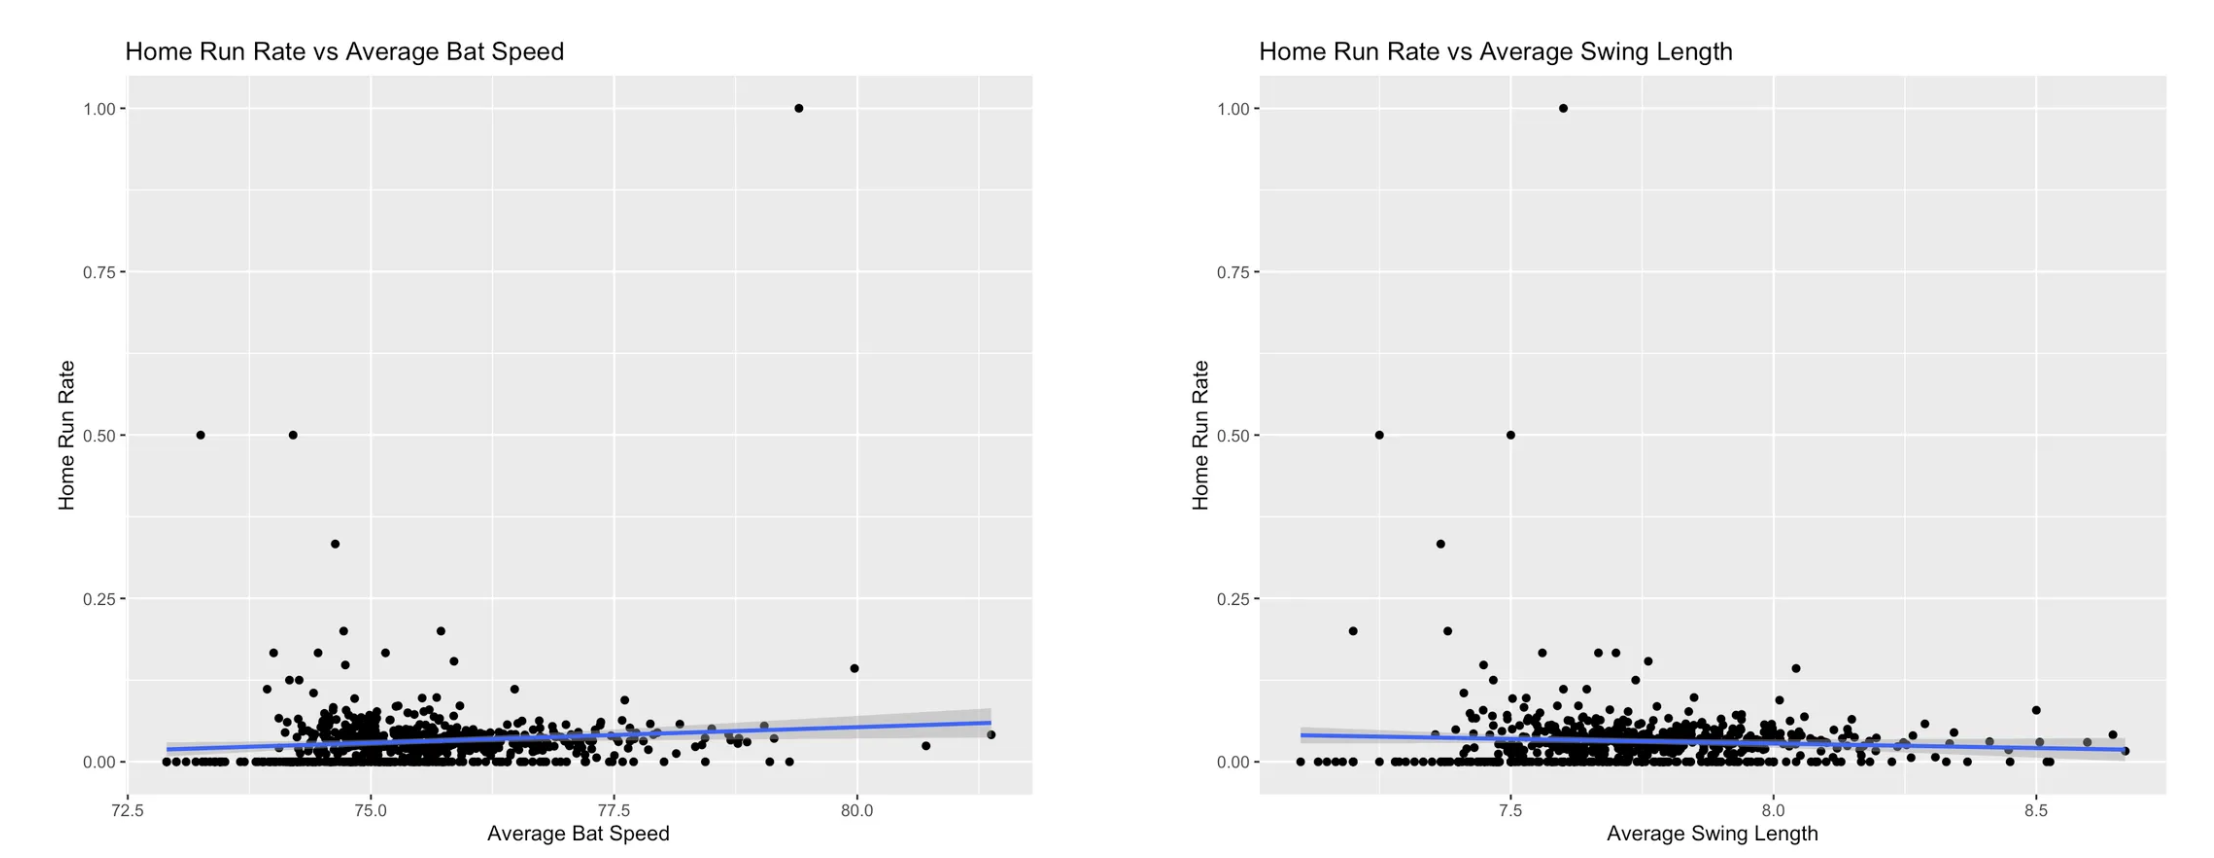
Looking at the charts above, we can see that the bat speed and swing length does not actually seem to correlate as much to the home run success rate as we have expected. This might mean couple of things:
- There might be an optimal range to have a better successful home run rate than a "higher is better" kind of relationship.
- The timing and the point of contact might matter more significantly than just a bat speed and a swing length.