UK-ecommerce Retention Analysis
Table of Contents
1. Overview
1-1. Problem
1-2. Analytical Method: Cohort / Retention
Definition of retained customer
We defined retained customer as customers who are registered to the service and have ordered from the service more than once.
We have limited our customer data to be within UK.
Defining Cohort
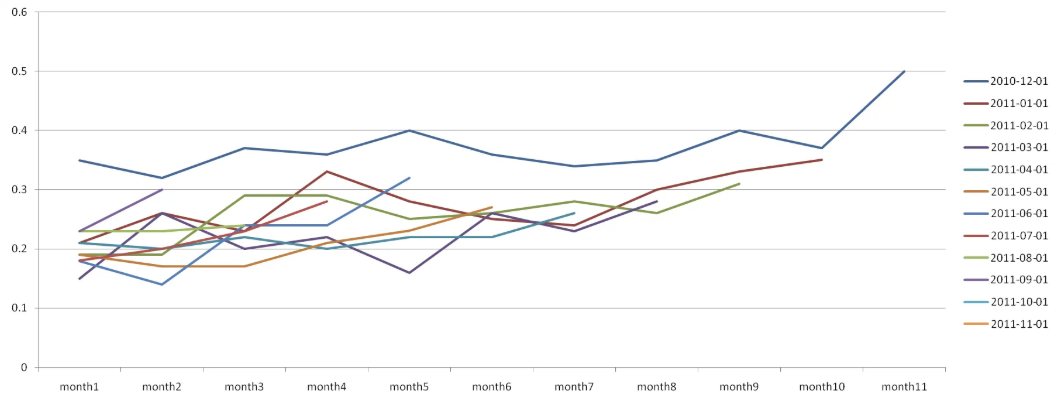
From the service launch in December 2010 to November 2011, we plan to analyze retention based on purchase orders by grouping 'first-time purchasers' into the same cohorts at monthly intervals.
SQL query for customer's purchase cycle (Reference page)
View SQL Query
SELECT MEDIAN(customer_avg_buying_cycle) AS avg_buying_cycle
FROM (
    SELECT customer_id
        , CASE WHEN order_count - 1 == 0 THEN 0
                ELSE order_date_diff / (order_count - 1)
        END AS customer_avg_buying_cycle
    FROM (
        SELECT customer_id
            , EXTRACT('epoch' FROM DATE_TRUNC('day', last_order_date - first_order_date))/3600/24 AS order_date_diff
            , order_count
        FROM (
            SELECT customer_id
                , MIN(order_date) AS first_order_date
                , MAX(order_date) AS last_order_date
                , COUNT(DISTINCT order_id) AS order_count
            FROM retail_cleaned
            GROUP BY 1
        ) AS step1
    ) AS step2
) AS step3
Retention Chart
View Retention Chart SQL Query
WITH retail_cleaned AS (
SELECT *
, MIN(order_month) OVER(PARTITION BY customer_id) AS first_order_month
FROM retail
WHERE country = 'United Kingdom'
AND order_date NOT LIKE '2011-12%'
AND category != '삭제'
AND customer_id IS NOT NULL
AND unit_price >= 0.01
)
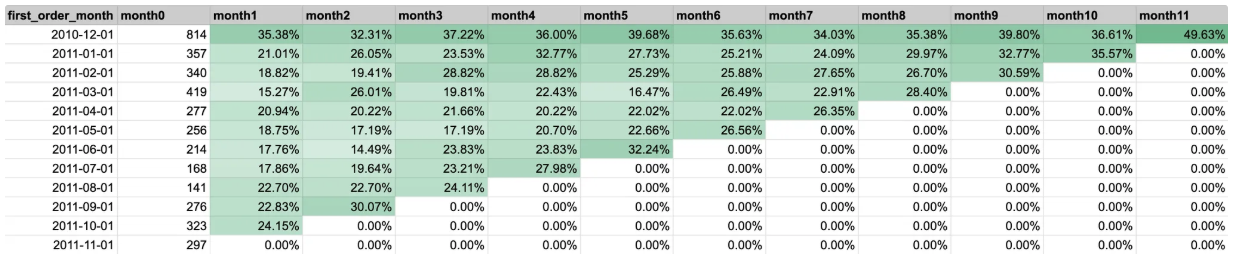
SELECT first_order_month
,month0
,ROUND(IF(month1 = 0, 0, month1 / month0 * 100) ,2) AS month1_pct
,ROUND(IF(month2 = 0, 0, month2 / month0 * 100) ,2) AS month2_pct
,ROUND(IF(month3 = 0, 0, month3 / month0 * 100) ,2) AS month3_pct
,ROUND(IF(month4 = 0, 0, month4 / month0 * 100) ,2) AS month4_pct
,ROUND(IF(month5 = 0, 0, month5 / month0 * 100) ,2) AS month5_pct
,ROUND(IF(month6 = 0, 0, month6 / month0 * 100) ,2) AS month6_pct
,ROUND(IF(month7 = 0, 0, month7 / month0 * 100) ,2) AS month7_pct
,ROUND(IF(month8 = 0, 0, month8 / month0 * 100) ,2) AS month8_pct
,ROUND(IF(month9 = 0, 0, month9 / month0 * 100) ,2) AS month9_pct
,ROUND(IF(month10 = 0, 0, month10 / month0 * 100) ,2) AS month10_pct
,ROUND(IF(month11 = 0, 0, month11 / month0 * 100) ,2) AS month11_pct
FROM (
SELECT LEFT(first_order_month,10) AS first_order_month
,COUNT(DISTINCT customer_id) AS month0
,COUNT(DISTINCT CASE WHEN DATE_ADD(first_order_month, INTERVAL 1 MONTH) = order_month THEN customer_id END) AS month1
,COUNT(DISTINCT CASE WHEN DATE_ADD(first_order_month, INTERVAL 2 MONTH) = order_month THEN customer_id END) AS month2
,COUNT(DISTINCT CASE WHEN DATE_ADD(first_order_month, INTERVAL 3 MONTH) = order_month THEN customer_id END) AS month3
,COUNT(DISTINCT CASE WHEN DATE_ADD(first_order_month, INTERVAL 4 MONTH) = order_month THEN customer_id END) AS month4
,COUNT(DISTINCT CASE WHEN DATE_ADD(first_order_month, INTERVAL 5 MONTH) = order_month THEN customer_id END) AS month5
,COUNT(DISTINCT CASE WHEN DATE_ADD(first_order_month, INTERVAL 6 MONTH) = order_month THEN customer_id END) AS month6
,COUNT(DISTINCT CASE WHEN DATE_ADD(first_order_month, INTERVAL 7 MONTH) = order_month THEN customer_id END) AS month7
,COUNT(DISTINCT CASE WHEN DATE_ADD(first_order_month, INTERVAL 8 MONTH) = order_month THEN customer_id END) AS month8
,COUNT(DISTINCT CASE WHEN DATE_ADD(first_order_month, INTERVAL 9 MONTH) = order_month THEN customer_id END) AS month9
,COUNT(DISTINCT CASE WHEN DATE_ADD(first_order_month, INTERVAL 10 MONTH) = order_month THEN customer_id END) AS month10
,COUNT(DISTINCT CASE WHEN DATE_ADD(first_order_month, INTERVAL 11 MONTH) = order_month THEN customer_id END) AS month11
FROM retail_cleaned
GROUP BY first_order_month
ORDER BY first_order_month
)retention_pct1-3. Hypotheses
- Reason for not choosing sales amount:
- It would be better to analyze based on the order volume considering the fact that there are instances of bulk purchases from a single location
- Order volume vs Order quantity:
- We thought securing many different customers purchasing the item was more significant compared to securing one customer who purchases a lot of items
- We thought customers who bought the items in
CHRISTMAScategory in their first purchase are likely to be temporarily acquire customers who only used our service to buy seasonal products.
- As the customer proportion for
CANDLEcategory products in the 2010-12 cohort was as high as the customer proportion forCHRISTMAScategory products, we tried to verify whether this has an impact on customer retention.
2. Results
2-1. The Top 5 Subcategories Based on Order Volume
Order volume → Based on the number of customers who placed orders
| <Group A> (2010-12 Cohort) | <Group B> (Cohort excluding 2010-12) | ||||
|---|---|---|---|---|---|
| subcategory | Order volume | Customers (proportion) | subcategory | Order volume | Customers (proportion) |
| CANDLE | 2960 | 627 (77.03%) | CANDLE | 3906 | 1909 (62.22%) |
| PARTY DECOR | 2238 | 534 (65.6%) | CHRISTMAS | 3124 | 1761 (57.4%) |
| DRINKWARE | 2099 | 541 (66.46%) | PARTY DECOR | 2854 | 1537 (50.1%) |
| CHRISTMAS | 2039 | 613 (75.31%) | BAKEWARE | 2655 | 1439 (46.9%) |
| LUNCHWARE | 1954 | 392 (48.16%) | DRINKWARE | 2568 | 1441 (46.97%) |
When comparing the top 5 subcategories of the two cohorts based on the order quantity, there wasn't a significant difference in the ranking list. However, there was a meaningful difference when we compared the customer proportions.
- For
CANDLEcategory products, the customer proportion in Group A is approximately 15% higher than in Group B - For
PARTY DECORcategory products, the customer proportion in Group A is approximately 15% higher than in Group B - For
CHRISTMAScategory products, the customer proportion in Group A is approximately 18% higher than in Group B - For
DRINKWAREcategory products, the customer proportion in Group A is approximately 20% higher than in Group B
→ We observed that the CANDLE, PARTY DECOR, CHRISTMAS, and DRINKWARE category products, which were purchased by a large number of orders and a high proportion of customers in Group A, had a different impact on retention compared to Group B.
2-2. Christmas Related Item in First Purchase
| cohort | month0 | month1_pct | month2_pct | month3_pct | month4_pct | month5_pct | month6_pct | month7_pct | month8_pct | month9_pct | month10_pct | month11_pct |
|---|---|---|---|---|---|---|---|---|---|---|---|---|
| christmas | 1346 | 23.4 | 18.5 | 16.86 | 15.01 | 15.9 | 15.38 | 13.52 | 12.33 | 12.63 | 11.37 | 14.86 |
| non_christmas | 2536 | 20.62 | 22.12 | 22.44 | 23.94 | 21.73 | 19.76 | 17.51 | 17.27 | 14.79 | 10.73 | 8.04 |
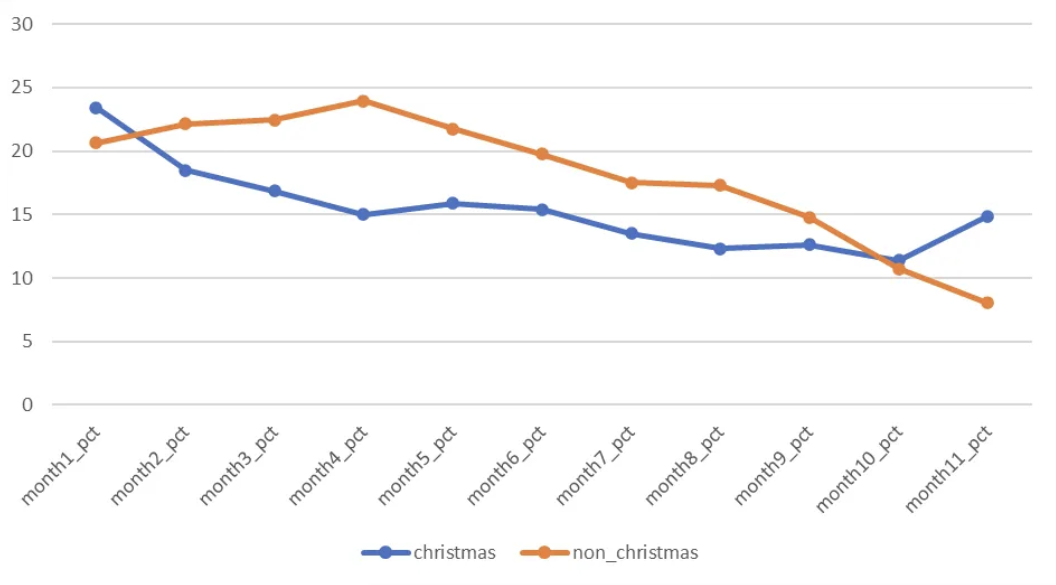
The cohort that purchased CHRISTMAS items in their first purchase has lower retention compared to the cohort that did not.
- The retention rate for the
CHRISTMAScohort is at max 23.4%, with an average of 15.43%. - The retention rate for the
NON_CHRISTMAScohort is at max 23.94%, with an average of 18.09%.
2-3. Previously Purchased Candle Related Items
| cohort | month0 | month1_pct | month2_pct | month3_pct | month4_pct | month5_pct | month6_pct | month7_pct | month8_pct | month9_pct | month10_pct | month11_pct |
|---|---|---|---|---|---|---|---|---|---|---|---|---|
| candle | 2536 | 26.06 | 25.08 | 25.43 | 25.87 | 25.24 | 22.24 | 20.43 | 19.44 | 17.55 | 14.47 | 13.64 |
| non_candle | 1346 | 13.15 | 12.93 | 11.22 | 11.37 | 9.29 | 10.7 | 8.02 | 8.25 | 7.43 | 4.31 | 4.31 |
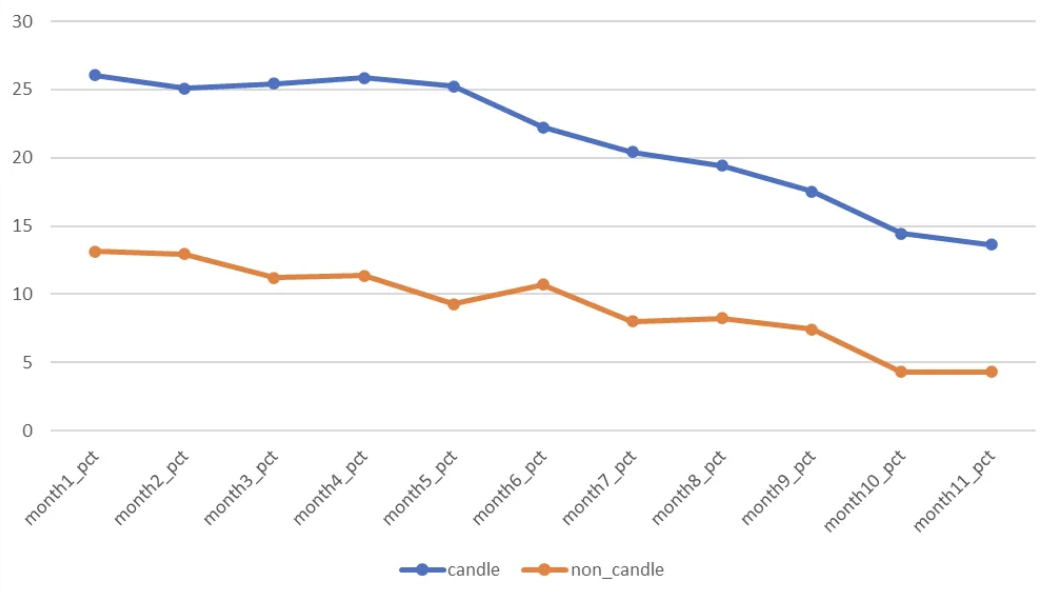
The retention of the cohort that has previously purchased CANDLE products is noticeably higher than the cohort that has not.
- The retention rate for
CANDLEcohort has an average of 21.4% - The retention rate for
NON_CANDLEcohort has an average of 9.18%
3. Action Plan
4. About the Dataset
Column Information
| Original column name | New column name | Description |
|---|---|---|
| InvoiceNo | order_id | Invoice number. Nominal, a 6-digit integral number uniquely assigned to each transaction. If this code starts with letter 'c', it indicates a cancellation. |
| StockCode | product_id | Product (item) code. Nominal, a 5-digit integral number uniquely assigned to each distinct product. |
| Description | description | Product (item) name. Nominal. |
| Quantity | quantity | The quantities of each product (item) per transaction. Numeric. |
| InvoiceDate | order_date | Invoice Date and time. Numeric, the day and time when each transaction was generated. |
| UnitPrice | unit_price | Unit price. Numeric, Product price per unit in sterling. |
| CustomerID | customer_id | Customer number. Nominal, a 5-digit integral number uniquely assigned to each customer. |
| Country | country | Country name. Nominal, the name of the country where each customer resides. |
| Added | order_month | Order date expressed in monthly intervals. |
| Added | first_order_month | First order date expressed in monthly intervals. |
| Added | total_amount | Total amount of the item including the quantity and unit price. |
5. EDA HISTORY
5-1. Data Cleaning → Write a csv file with the cleaned data
- Dropped
cancelled order values - Dropped
rows where quantity & unit_price < 0 - Dropped
abnormal description values
R code
View R Code
library(dplyr)
library(data.table)
library(lubridate)
library(stringr)
library(clipr)
library(usethis)
library(readxl)
library(writexl)
library(dlookr)

retail <- read_xlsx("Online Retail.xlsx")
retail

retail <- retail %>%
   rename(order_id = "InvoiceNo", product_id = "StockCode",
          description = "Description", subcategory = "Subcategory",
          category = "Category", order_date = "InvoiceDate",
          unit_price = "UnitPrice", customer_id = "CustomerID",
          country = "Country", quantity = "Quantity")

retail

# drop abnormal description values
desc_drop <- c("add stock to allocate online orders",
               ...
               "20713")

retail_df <- retail %>%
   filter(description != desc_drop)

# drop cancelled order values
retail_df <- retail_df %>%
   filter(!str_detect(order_id, '^C'))

# drop rows where quantity & unit_price < 0
retail_df <- retail_df %>%
   filter(unit_price > 0,
         quantity > 0)

# chec
retail_df <- retail_df %>%
   mutate(order_month = format(as.Date(order_date), "%Y-%m")) %>%
   mutate(total_amount = quantity * unit_price)retail_df %>%
   filter(str_detect(order_id, '^C'))

# Save to csv file
write.csv(retail_df, "retail.csv", row.names = F)
5-2. Categorizing Products
Faced a challenge where it is difficult to identify unique differentiation among customers using existing information.
Categorized a total of 4,211 unique product names (description)
| Before | After |
|---|---|
| 4,211 uncategorized products | Categorized to 22 categories, and 255 subcategories |
5-3. Final EDA
Completed the final filtering conditions to extract only the necessary information for our analysis.
customer_id: drop null values → filter customers who did not register to our servicecountry: United Kingdom → limiting dataset within the UK- Filter all purchse data in 2011-12 → Only 9 days worth of data exists in the dataset
category: drop abnormal valuesunit_price: filter abnormal values that is below the lowest possible unit price- Add
first_order_monthcolumn
SELECT *
     , MIN(order_month) OVER(PARTITION BY customer_id) AS first_order_month
FROM retail
WHERE country = 'United Kingdom'
AND order_date NOT LIKE '2011-12%'
AND category != '삭제'
AND customer_id IS NOT NULL
AND unit_price > 0.01